In order to remedy this I would like to write a program that can visualise these programs for me. The success criteria are as follows:
- It should show a code listing alongside the visualisation when it is running.
- It should somehow reflect what part of the code listing is being executed
- The code listing should look as much like normal JavaScript source code as possible
- The visualisation should look pretty
- The visualisation should be easy to follow
- The visualisation should have speed controls
The code listing
To create the code listing initially I just had the function copied to a dom element. But this did not work later on as I did transformations to the code to make the visualisation more cohesive, it also had the drawback that it was difficult to use and ugly. What I ended up with in the end was I created a mapping from line number to visualisation step, then ran the initial code through the syntax highlighter I created for this site to make it look less ugly, then split it by line so that each could be specifically referenced.
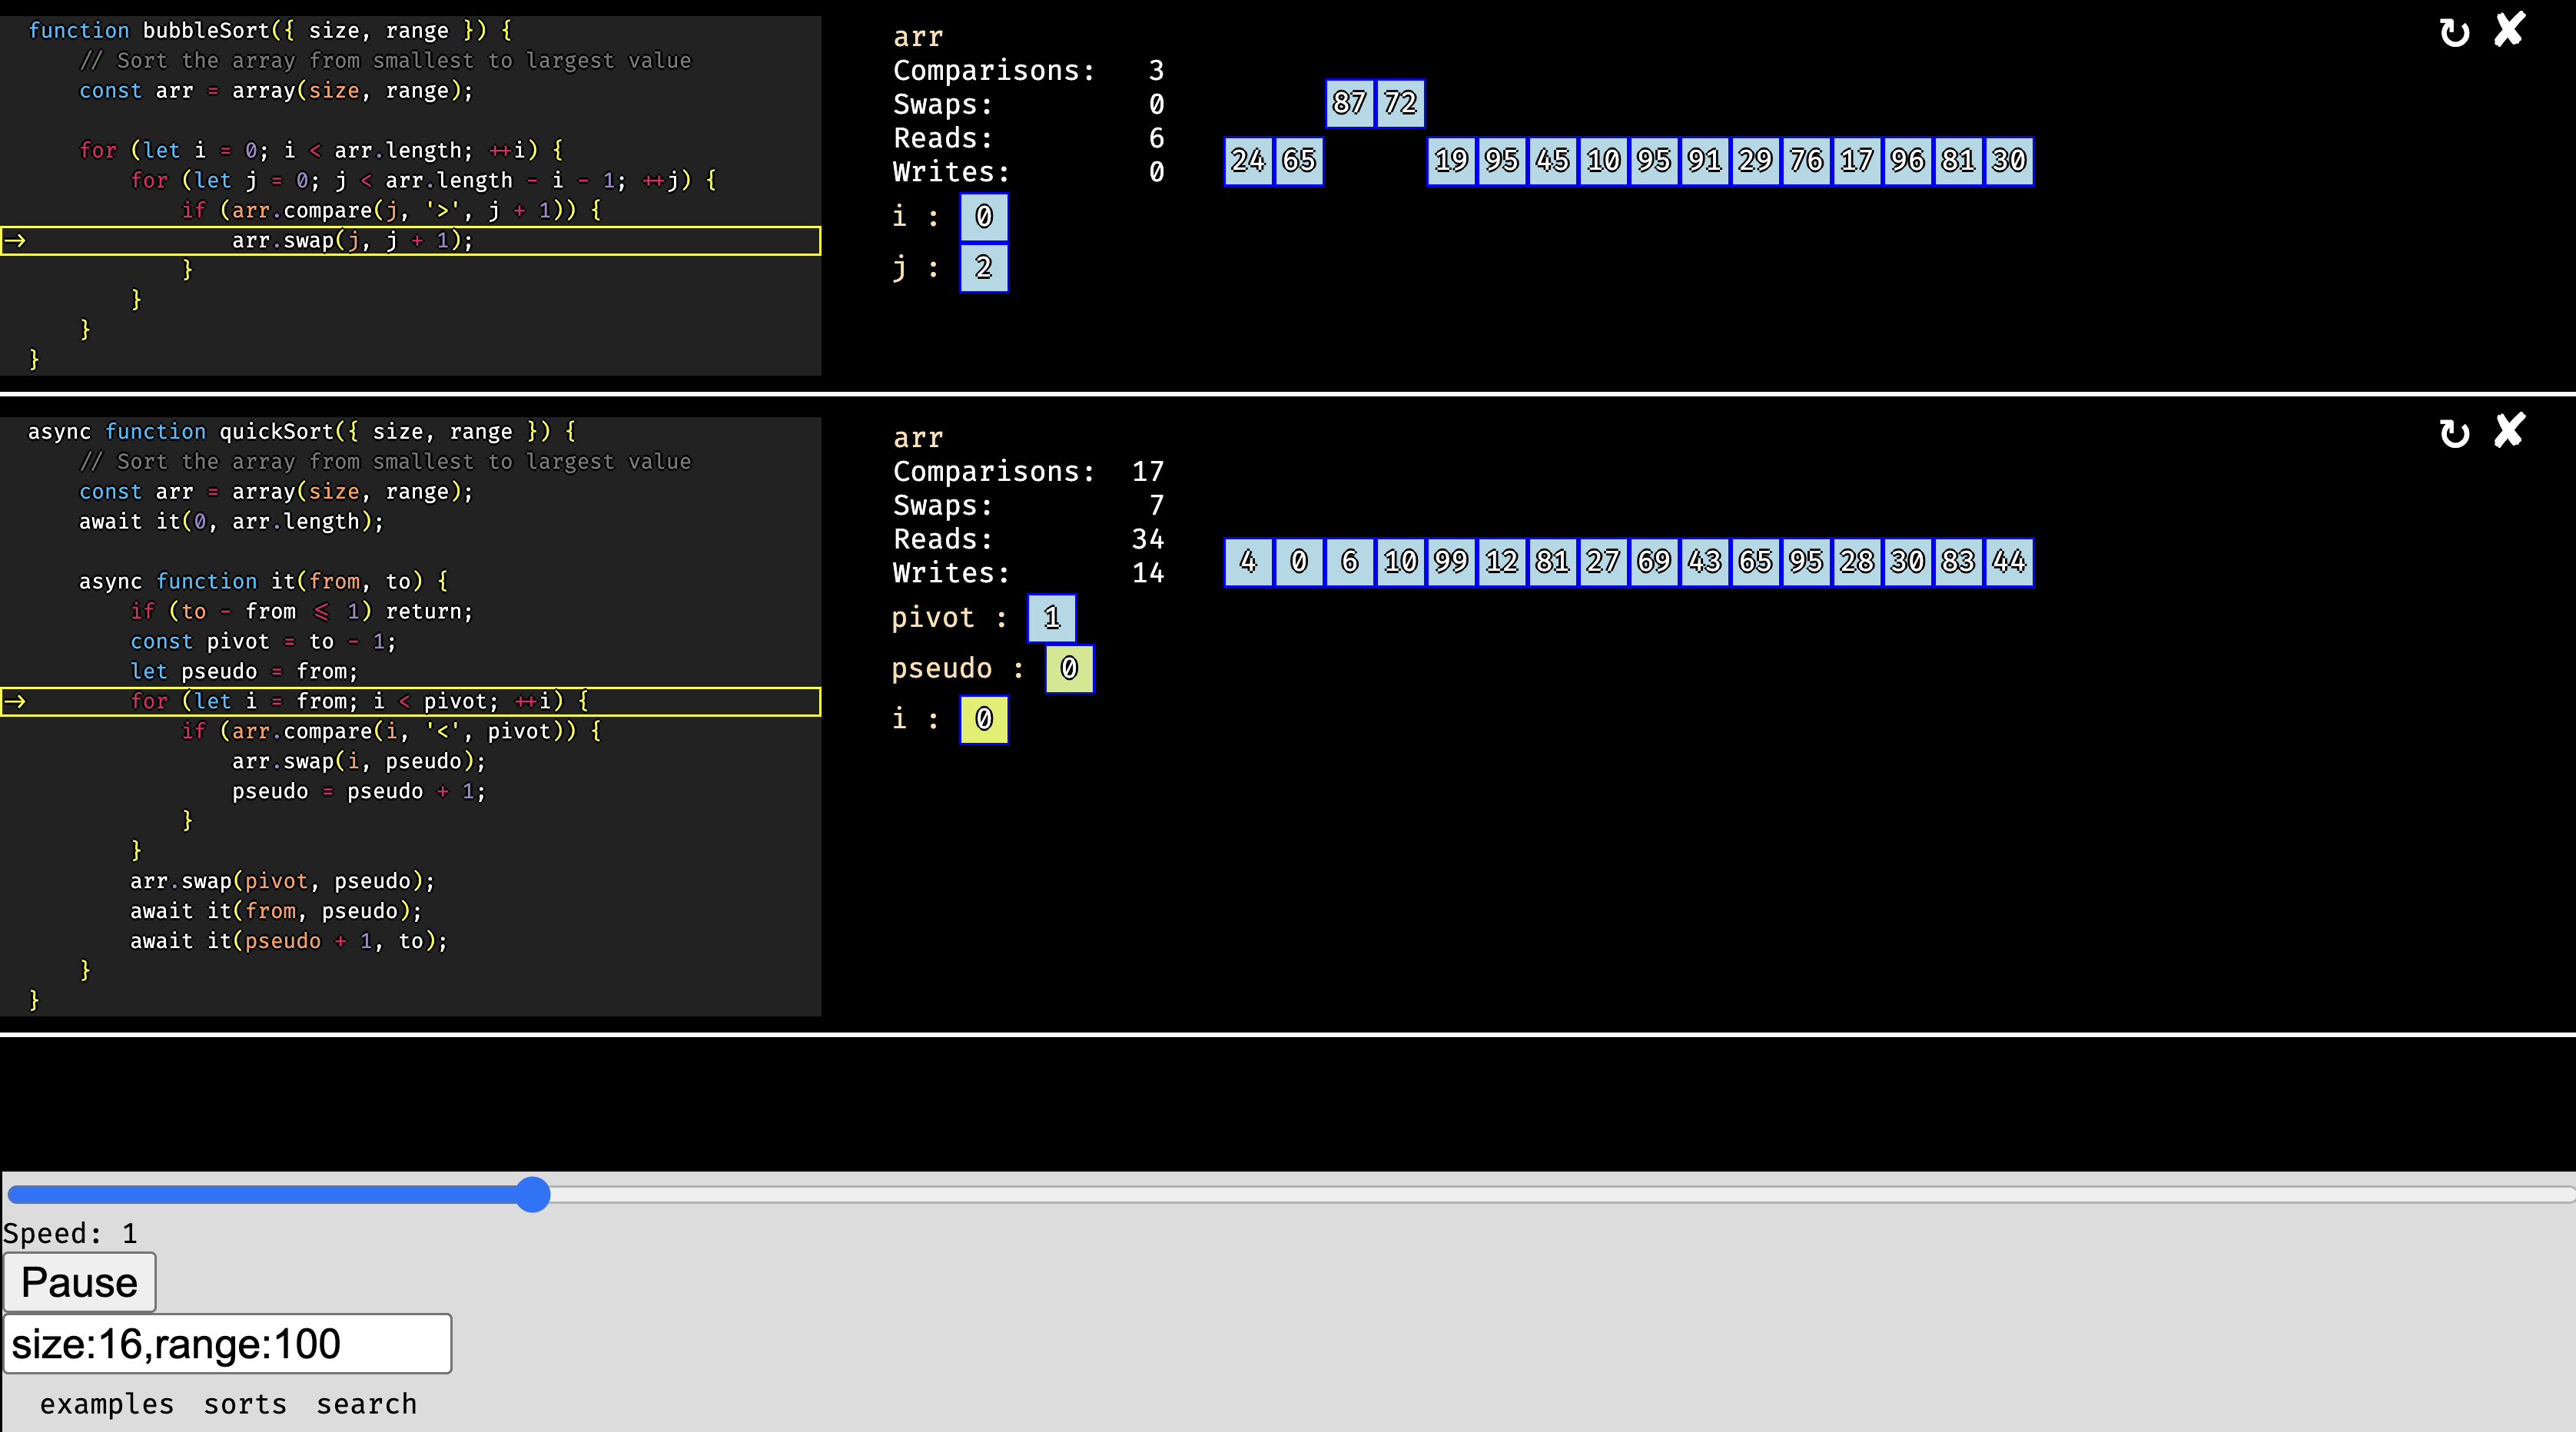
The visualisation
The visualisation consists of a series of variables, with their values listed as visually boxed values, and in the case of arrays, a series of boxed values. Whenever an operation effects one of these values an animation is played to highlight the change that has happened. Along with this, the code listing is updated to show what part of the code is being executed.
Finishing touches
To make using this tool a better experience, I included several controls including:
- A speed control slider
- A pause button, to pause execution
- Restart or remove a specific program
- Change the input size
- Change the input range
- A menu of examples
 Overall I think that the visualisation was a success although I am still unhappy that it still requires a couple of changes to the source. The visualisation was a useful teaching aid and made explaining algorithms much easier.
It is available at dev.ab24.xyz/cvs